NumbersCoach_Logo_Endorsed_UnderLogotype_2
  • Numbers Coaching
    • The Numbers Navigator®
    • Case Studies
  • About
    • Trillium-Numbers Coach Story
  • Resources
    • Blog
    • Numbers Coach TIPS
    • Podcasts
    • Numbers Coach Tools
  • Numbers Coach University
  • Contact
  • Search

How to Spot These 6 Financial Warning Signs and What They Mean

March 4, 2026 by greenmellen

If you read the headlines of national and local news, it is amazing that so many businesses are seemingly strong one day, and the next they are closing or filing for bankruptcy.

One of the many reasons this happens is that business owners and managers don’t pay attention (or don’t want to acknowledge) the financial warning signs that could have saved them. By the time the financial collapse starts, it’s often too late to change course.

6 Warning Signs You Can Look For

To help you spot these warning signs, here are the 6 financial red flags that we coach our clients to take action against:

  1. [The Most Telling Sign] Cash Holdings and Equity Are Lower Compared to the Previous Periods
    Take a look at your balance sheet and income statement to determine your overall cash holdings and equity (Assets-Liabilities). If your liabilities are higher, ask why.  Negotiate terms to lower credit rates, extend payment terms, etc. Involve other departments to determine how your business can operate more efficiently and cost-effectively. Discuss simple ways to increase revenue without significantly increasing overhead.
  2. Days in Accounts Receivable Increasing
    Many customers are pushing the envelope with their payment terms. Create a process for collecting outstanding receivables, and ratchet it up when customers start paying late. Customers often pay those vendors with strong systems, and delay payment to those suppliers who don’t have solid collections practices. This doesn’t mean that you won’t work with a long-standing customer who asks you for some flexibility. It does mean that you implement smart AR strategies such as late payment fees, outsourced collections help and credit reporting with clear communication and consistency.
  3. Not Enough Cash Flow for Accounts Payable
    Order in smaller quantities of goods/services from your suppliers. Talk to vendors to negotiate extended terms, leveraging your long-standing relationship and good business practices.  Use a credit card with 60-day terms to maximize the number of days to pay (make sure to review your credit card agreement and understand the terms). Search for discounts for paying within terms if your suppliers won’t stretch the terms. These strategies may not impact your cash flow immediately, but they can have an overall impact by improving your bottom line, since you are buying product or services at a lower price. Get a good handle on your inventory, turn rate, spoilage, sales trends, etc. so you actually buy smarter.
  4. Evaluate Profit Margins and Turnover Ratios
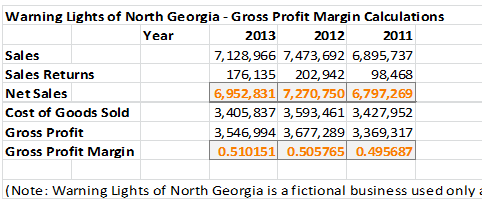
    We all know that decreasing profit margins are a bad sign, but they can’t be evaluated alone. Turnover ratios are also an important factor. Remember, mega grocery stores and warehouse clubs have low profit margins, but high turnover ratios that result in adequate net income and, more importantly, reasonable cash flow. The key is to look at both your profit margins and turnover rates together because how they interact will ultimately tell you how much cash has flowed into your bank account.
  5. Indirect Overhead Growing with Increase in Sales
    Take a hard look at operations. Are you running as efficiently as you could be? Are your employees productive or can they take on more responsibilities? There are more costs to adding employees than just salary, benefits and taxes. You have equipment, space, recruiting/training time, etc. for each employee you hire. The goal is to increase sales without increasing your fixed overhead. If you find there is nothing you can do to avoid increasing your fixed costs, you might need to re-evaluate your business strategy to determine how you can raise your profit margins to accommodate for your increase.
  6. Warning Signs Outside Your Business
    Every business should use and review a weekly dashboard that includes many of the warning sign financial metrics listed above: gross profit margin, average daily outstanding AR, inventory turns, days payable outstanding, available line of credit, operating profit margin, etc.  But ultimately, there are other warning signs that may not be on your dashboard.   Below is a story from a business who engaged a trusted advisor for an outside perspective.

 A Real-World Example of Heeding the Warning Signs

“Most people under-emphasize the available line of credit,” says Joe Dresnok, a consultant with Management Horizons. “The perfect storm for a company is a down economy, reduced sales and the inability to reduce overhead. When this happens, a company needs to access their credit lines to get through the tough times, and invest in other avenues to generate revenue.”

But during a slow economy, banks will reduce credit lines. One of Joe’s clients had a $300,000 line of credit, of which they had drawn down 1/3.  Joe and his team recommended the client draw down the rest of the credit line. Within 30 days, the bank came to give the “bad news” that they were reducing the company’s credit line to $100,000. The company was happy to report they had already tapped out all $300,000 of the original credit line. “In essence, they preserved $200,000, which translated to staying power.”  In this case, it was definitely worth the cost of that credit to preserve the line.

Each company has its own specific set of measurements (metrics) to help owners understand what to look out for in their financials. (Here are the 8 essential financial metrics we recommend tracking.)  This will at least give you the chance to prevent your company from embodying a quote from Ernest Hemingway:  When asked how one goes bankrupt, he said “Two ways:  Gradually, and then suddenly.”

Watch for the warning signs!

Filed Under: Blog, Financial Metrics, Financial Modeling, Financial Tools, Key Performance Indicators, Numbers Coaching, Own Your Numbers Tagged With: business financial planning, financial analysis, financial dashboard, financial metrics, financial reporting, key performance indicators, KPI, metrics

What’s the Key Number You Rely On Daily?

November 12, 2025 by greenmellen

by Bernadette Peters

Key performance indicators can tell us how well we are doing in our businesses.  But sometimes waiting for accounting software data entry and reporting can be too late for us to make important adjustments quickly.

Many businesses rely on key numbers they can access quickly each day to give them an idea of how they are really doing financially. It can take some time to figure out what that metric is, however, once you do, you are much more prepared to make smart business decisions on the fly.

Coffee Shop Looks at 3 Sales Categories

A young coffee shop and wine bar owner was tracking daily revenues to determine the appropriate number of staff to schedule on a shift.  An early mistake they made was to staff only on the basis of revenue. They later learned that transactions were much smaller and the volume was much higher in the mornings, requiring more staff. And although revenues were much stronger in the evening, higher transactions and retail wine sales required less manpower. Now they look at three distinct categories of sales: coffee drinks, retail wine and enter orders. They can get this information at any time through their point of sale system, which is updated instantly as transactions occur.

Management is able to understand peak volume times and days by looking at this data over an extended period of time. From this information they can understand how to better staff their operation to ensure high-quality customer service experience.

Strategy Consulting Firm Drills Deeper

A typical strategy consulting firm would normally review income and expenses after services have been completed and billed.  However, one firm in particular reviews several other numbers to determine how well they are doing and what adjustments to make along the way.

Jeff Pruett, CFO at ATPAC Group, previously worked as the CFO of a marketing strategy consulting company.  He indicated that his former consulting company looked not only at revenue per consultant, but they also determined how to maximize a consultant’s 40-hour work week via revenue per full-time equivalent employee company wide. This allowed management to determine the ideal work force size. 

Jeff also reviewed how much of the consulting pool’s time was spent on billable and productive activities as opposed to “bench” time to understand how consultants are utilized and billed. He also reviewed project contribution margins as part of ongoing analysis of an in-process job to see if the job is getting in to trouble prior to its delivery and whether it’s losing margin.

What are Your Key Daily Numbers?

What are the key daily numbers that are essential to making decisions about your business on the fly?Determining what these numbers are in your particular business might require some help from a professional, but once you do, your management team can be much better prepared to make smart proactive business decisions. It may require measuring numerous metrics for a period of time, sometimes even two years or more, before you can figure out which metric or group of metrics are truly predictive for your business.

Need some guidance in determining these metrics? The Numbers Coach is here to help. Contact us today for a complementary review session of your numbers.

Filed Under: Blog, Business Growth, Financial Metrics, Key Performance Indicators, Numbers Coaching, Own Your Numbers Tagged With: financial metrics, key performance indicators, KPI, metrics

Mastering the Art of Cash Outflow Forecasting in Your Business

September 23, 2025 by Mike Iverson

Cash flow is the lifeblood of any business, and managing it effectively is crucial for your overall success. One of the key aspects of cash flow management is forecasting cash outflows. By accurately predicting where your money will be going, you can make informed decisions, avoid financial surprises, and ensure that your business remains financially healthy.

10 Tips for Cash Outflow Forecasting

Here are 10 essential steps to help you forecast cash outflows in your business:

  1. Gather Historical Data: Start by examining your past financial records. Analyze your previous cash outflows to identify trends and patterns. This historical data will serve as a valuable reference point for making future forecasts.
  2. Categorize Expenses: Divide your expenses into fixed and variable categories. Fixed expenses, like rent or loan payments, remain consistent. Variable expenses, such as utilities or raw materials, can fluctuate based on your business activities.
  3. Identify Timing: Take note of when your expenses are due. Some payments may be monthly, while others could be quarterly or annually. This timing is critical for a precise cash flow forecast.
  4. Project Future Expenses: Use your historical data and business plans to estimate future cash outflows. Be thorough and account for all potential expenses, even those that occur irregularly.
  5. Prioritize Payments: Determine the priority of each payment. Essential expenses that are directly tied to your core operations, like salaries or rent, should be paid first. This ensures that your business continues to run smoothly.
  6. Consider Seasonal Fluctuations: If your business experiences seasonal variations, account for this in your forecast. Some months may require higher cash reserves to cover increased expenses.
  7. Risk Assessment: Be mindful of potential risks and uncertainties that could impact your cash flow, such as economic downturns or unexpected expenses. Having a contingency plan is essential.
  8. Use Technology: Leveraging accounting software and financial forecasting tools can streamline the process and enhance accuracy. These tools, such as our Cash Flow Tool Kit, can help you create detailed financial projections and scenarios.
  9. Regularly Update Your Forecast: Your cash flow forecast should be a dynamic document. Update it regularly with actual results.
  10. Monitor and Adjust: Keep a close eye on your actual cash flow compared to your forecast. If deviations occur, adjust your strategies accordingly. This ongoing monitoring helps you stay on top of your financial health.

Forecasting cash outflows is a fundamental aspect of financial management for any business. By understanding your past financial data, planning for future expenses, and adapting to changing circumstances, you can ensure that your business remains financially resilient and capable of weathering a financial storm. A well-executed cash outflow forecast is an invaluable tool that empowers you to make informed decisions and secure the financial stability of your business.

Be sure to check out our Cash Flow Tool Kit, which includes helpful templates to build your forecast.

Filed Under: Cash Flow Forecasting, Cash Flow Planning, Financial Tools Tagged With: financial metrics

Do You Know What This Financial Warning Sign Could Mean For Your Business?

September 20, 2025 by greenmellen

Owners are often so immersed in the day-to-day details of their businesses that they can’t always see financial warning signs of tough times ahead. If you can’t see the warning signs, you can’t avoid the danger.

At the Numbers Coach, we teach business owners how to spot the warning signs. We closely monitor revenues, receivables and cash flows. These three figures are closely related. Businesses often struggle because of poor cash flow, which usually indicates declining revenues and/or slow collection of business receivables.

12/12 Rate of Change

One of my favorite tools to spot early financial warning signs of potential trouble is a chart called the 12/12 rate of change. During difficult economic conditions, I watch this rate of change closely. If I start to see it slip from 20 percent to 19 or 18 percent, we need to investigate why. If a business continues down that path for too long, the impact will be quite negative.

Let’s take revenues as a simple example. Each month, we calculate total revenues for the past 12 months and we compare it against the same figure for the prior year. Then, we calculate the rate of change from last year to this year. If last year’s 12-month revenue figure is $1 million and this year’s 12-month revenue figure is $1.2 million, we have a 20 percent rate of change. Perhaps you can’t change the revenue figure during tough times, because customers postpone the purchase of your product or service. In that event, it may be possible to lower your expenses and avoid losing money.

The 12/12 rate of change provides a long-term view of your business. It is very useful for spotting changes in a business trend, positive or negative, that have occurred during the past year.

12/12 Rate of Change for Fixed Overhead

To take the analysis a step further, I like to review the 12/12 rate of change for the fixed overhead of a business. It tends to be a leading indicator of future bottom-line results when combined with the 12/12 rate of change for revenues.

Fixed costs are those incurred whether you generate any revenue or not. They include rent and, for many service businesses, staff salaries and benefits.

Let’s imagine a business has a 12/12 rate of change for revenues that shows 5 percent growth. If the 12/12 rate of change for fixed overhead shows 10 percent growth, the business has a problem to address. The business is adding to its fixed overhead at a rate that exceeds top-line revenue growth. That’s a financial warning sign. Because of the long-term nature of the 12/12 rate of change, there is no need for immediate panic. However, if the situation is not remedied, it will pose a threat to the future health of the business.

To investigate further, I look at the trailing 12 months of revenues and fixed overhead expenses – not the rate of change, just gross dollar amounts. Is the revenue increasing or decreasing? We plot points on a graph to develop a clear trend line. We do the same for fixed overhead expenses. If, earlier in the year, you noticed an unhealthy rate of change trend and took corrective action, you can check your progress by reviewing the trailing 12. Using both metrics gives you a better read of the situation you face today.

What type of corrective action can you take? There are several possibilities, including increasing your sales, speeding up your collection cycle, or cutting expenses.  If you are not sure which path is best for your business, contact us for a free consultation.

Filed Under: Cash Flow Planning, Financial Metrics, Key Performance Indicators, Numbers Coach TIPS, Own Your Numbers Tagged With: business financial planning, financial analysis, financial education, financial leadership, financial management, financial metrics, key performance indicators

Option 1 Partners Builds Financial Road Map With Help From the Numbers Coach

June 17, 2025 by Mike Iverson

The Company

Option 1 Partners (“O1P”) is a consulting advisory firm started and nurtured by Jackie Flake and Ren Waldron.  O1P provides a full range of consulting services, including recruiting and talent acquisition, Agile transformation services, product strategy, product management, staff augmentation, and coaching. The company specializes in assessing your needs, matching it with teams to meet your vision, and help you build products and analysis for their client’s to successfully scale.  O1P has been providing its high-quality services for over 10 years. 

Situation

In 2025 the O1P team wanted to enhance their understanding of their financial results.  They wanted to use a platform to communicate the company’s key performance indicators (“KPIs”) and educate the leadership team members on what drives the company’s financial results.  The O1P team was missing a financial “road map” that could guide them to make better financial decisions for the company.

Solution: The Numbers Coach Leadership and Numbers NavigatorTM Services

The Numbers Coach (“NC”) financial leadership services were an ideal fit for O1P.  Using NC’s proprietary Numbers NavigatorTM platform, a financial scorecard is created to focus on measurements that drive company’s profits and cash flow critical to sustaining a business.  The scorecard offers the O1P team “at a glance” view of results.  In addition, the Number Navigator’sTM rolling financial forecast gives the O1P team a tool to make critical decisions and see their financial road ahead. 

Mike’s approach to coaching us on how to understand our financial results gives our team the tools to help us navigate our finances successfully and stay focused on our cash flow and investment goals.

~Jackie Flake & Ren Waldron, Co-Founders of Option 1 Partners

Results

NC pulled together financial and non-financial data to complete a scorecard, financial model, and supplemental reporting.  Each quarter the O1P team meets with the Numbers Coach to methodically review results and provide input and analysis from the Numbers NavigatorTM.  After each Numbers Coach meeting, the O1P team can act on activities that improve the company’s bottom line.  Jackie, Ren, and their team can access the Numbers NavigatorTM at any time with its cloud-based delivery platform.

For more information on Option 1 Partners visit www.option1partners.com

To learn more about the Numbers Coach financial leadership services, click here

Filed Under: Case Study, Financial Modeling, Financial Tools, Key Performance Indicators, Leadership, Numbers Coaching Tagged With: business financial planning, financial management, financial metrics

The Numbers Coach Stitches Together Financial Plan for Fabric Company

April 17, 2025 by greenmellen

big duck canvas logo

The Company
Big Duck Canvas (“BDC”), founded by Shawn Mitchell, provides high quality fabrics, canvas and threads to both wholesale and retail stores. Their services include customer cut-and-sew fabrics and fabric printing, which adds a customer’s design features to a fabric. BDC distributes its products throughout North America and can be found online at www.bigduckcanvas.com

The Situation
The BDC team wanted to enhance their financial management and reporting. They were looking to create a platform to communicate the company’s key performance indicators (“KPIs”) that drive its financial results and gain a better understanding of their numbers. The BDC team wanted a financial “road map” that could guide them as they made financial decisions regarding strategies for growth.

The Solution: Numbers Coaching
Numbers Coach (“NC”) coaching services was an ideal fit for BDC’s needs. NC developed a financial scorecard focusing on financial drivers that gave the team visibility into the profits and cash flow critical to sustained profitable growth. The scorecard offers an “at a glance” view of results. NC also developed a financial model using its Numbers NavigatorR proprietary software, providing the financial road map for the BDC team to see where they were headed with profits and cash flow. The Numbers NavigatorR provides a rolling forecast, allowing the BDC team to make financial and operational decisions towards the achievement of their goals.

The Results
NC pulled together financial and non-financial data to complete a customized scorecard and a financial model. NC met with the BDC team regularly to review results and provide numbers coaching around the financial results. From the monthly meetings, the BDC team could take actions on activities to improve the company’s bottom line results and implement best practices.

Learn more about our Numbers Coach financial leadership services here

Filed Under: Business Planning, Case Study, Cash Flow Planning, Financial Modeling, Key Performance Indicators, Rolling Financial Forecast Tagged With: business financial planning, financial dashboard, financial education, financial leadership, financial management, financial metrics, financial reporting

Is Your Customer Creditworthy? 7 Key Metrics to Find Out

March 17, 2025 by Mike Iverson

When taking on a new client, your business is also taking on risk. What if your client doesn’t pay their bills? To minimize risk and ensure timely payments, it’s important to evaluate the creditworthiness of any business customer.

At the Numbers Coach, we recommend using these 7 key metrics to evaluate your customer and assess your business’s potential risk:

  1. Credit Score and History: A strong credit score and positive credit history indicate a reliable payment track record. Review their business credit report for any defaults, late payments, or bankruptcies. For a business, this is typically found through Dun & Bradstreet ratings or other business rating agencies such as Moody’s.
  2. Liquidity Ratios: Metrics like the current ratio (Current Assets / Current Liabilities) and quick ratio ((Current Assets−Inventory) / Current Liabilities) assess the customer’s ability to meet short-term obligations. Ratios above “1” generally indicate good liquidity.
  3. Debt-to-Equity Ratio (D/E): This ratio measures the level of financial leverage, calculated as Total Liabilities / Shareholders’ Equity. Lower ratios suggest the customer isn’t overly reliant on debt, reducing credit risk.
  4. Payment History: Review their payment behavior with other suppliers. Consistent on-time payments signal financial reliability.
  5. Financial Statements: If possible, get a set of financial statements for the past three years: ideally, a Balance Sheet, Income Statement, and Cash Flow Statement. Analyzing these statements will help you evaluate their ability to pay.
  6. References and Trade Insights: Obtain references from other vendors and industry insights to gauge the customer’s reputation and stability.
  7. Z-Score: If you can get financial information from your customer, then running it through a Z-Score calculation can be a helpful measure to ensure they are financially viable.

Using these metrics, you can make informed decisions and reduce your company’s exposure to bad debt.

Questions on any of these calculations? Feel free to ask the Numbers Coach.

Filed Under: Financial Metrics, Financial Tools, Numbers Coach TIPS, Own Your Numbers Tagged With: cash flow statement, credit risk, creditworthiness, financial management, financial metrics

Z-Score: What is it and how can it protect your business?

March 17, 2025 by Mike Iverson

The Altman Z-Score is a financial metric used to predict the likelihood of a business going bankrupt within the next two years. Developed by Edward Altman in 1968, it combines various financial ratios into a single score to assess a company’s financial health.


Formula for Altman Z-Score

The formula varies for different types of companies (public, private, manufacturing, or non-manufacturing). For publicly traded manufacturing firms, it is:

Z=1.2X1+1.4X2+3.3X3+0.6X4+1.0X5

Where:

  • X1​: Working Capital / Total Assets
  • X2: Retained Earnings / Total Assets
  • X3​: EBIT / Total Assets
  • X4: Market Value of Equity / Total Liabilities
  • X5​: Sales / Total Assets

Interpreting the Score

  • Z > 2.99: Low risk of bankruptcy (safe zone)
  • 1.81 < Z < 2.99: Moderate risk (gray zone)
  • Z < 1.81: High risk of bankruptcy (distress zone)

Uses in Business

  1. Risk Assessment: Investors and creditors use the Z-score to evaluate the financial stability of companies and assess credit risk.
  2. Decision-Making: Businesses use it for self-assessment, identifying financial weaknesses to improve operational efficiency and solvency.
  3. Comparative Analysis: The score helps compare financial health across firms, industries, or over time.
  4. Mergers & Acquisitions: Acquirers use the Z-score to assess the viability of target companies.

Limitations

  • It is less accurate for non-manufacturing or newer businesses.
  • Market value dependence can make it volatile in fluctuating markets.

Despite these limitations, the Altman Z-score remains a powerful tool for proactive financial management and decision-making.  It can be one of the tools in your “tool set” to analyze customers’ credit worthiness, target businesses to acquire, or understand your own company’s financial stability.


Understanding the Altman Z-Score for Business The Altman Z-Score is a financial metric used to predict the
likelihood of a business going bankrupt within the next two years. Developed by
Edward Altman in 1968, it combines various financial ratios into a single score
to assess a company’s financial health.


Formula for Altman Z-Score The formula varies for different types of companies (public,
private, manufacturing, or non-manufacturing). For publicly traded
manufacturing firms, it is: Z=1.2X1+1.4X2+3.3X3+0.6X4+1.0X5 Where:
  • X1​: Working Capital /
    Total AssetsX2:
    Retained Earnings / Total AssetsX3​: EBIT / Total AssetsX4:
    Market Value of Equity / Total LiabilitiesX5​: Sales / Total Assets


  • Interpreting the Score
  • Z
    > 2.99
    : Low risk of bankruptcy (safe zone)1.81
    < Z < 2.99
    : Moderate risk (gray zone)Z
    < 1.81
    : High risk of bankruptcy (distress zone)


  • Uses in Business 
  • Risk
    Assessment
    : Investors and creditors use the Z-score to evaluate the
    financial stability of companies and assess credit risk.Decision-Making:
    Businesses use it for self-assessment, identifying financial weaknesses to
    improve operational efficiency and solvency.Comparative
    Analysis
    : The score helps compare financial health across firms,
    industries, or over time.Mergers
    & Acquisitions
    : Acquirers use the Z-score to assess the viability
    of target companies.


  • Limitations 
  • It is
    less accurate for non-manufacturing or newer businesses.Market
    value dependence can make it volatile in fluctuating markets.
  •  Despite these limitations, the Altman Z-score remains a
    powerful tool for proactive financial management and decision-making.  It can be one of the tools in your “tool set”
    to analyze customers credit worthiness, targeting businesses to acquire, or
    understanding your own company’s financial stability.

    Filed Under: Financial Metrics, Financial Tools Tagged With: financial metrics

    Thermal Support Finds Financial Support with the Numbers Coach

    February 20, 2025 by Mike Iverson

    The Company

    Thermal Support (“TS”) is an international source for thermal analysis consumable products started and nurtured by Charles Beine.  TS provides a full range of thermal analysis DSC sample pans and TGA and TG/DTA sample pans. The company’s high-quality aluminum and ceramic pans are the standard as a non-OEM supplier.  TS serves a wide geographic area nationally and internationally, including labs and university research centers.  TS has been providing its high-quality products and support services for over 20 years. 

    Situation

    In 2024 the TS team wanted to enhance their understanding of their financial results.  They wanted to use a platform that communicated the company’s key performance indicators (“KPIs”) and educate its leadership team members on what drives the company’s financial results.  The TS team was missing a game plan that could guide them to make better financial decisions. Enter Numbers Coach Mike Iverson.

    Solution: The Numbers Coach Financial Leadership Services

    The Numbers Coach (“NC”) financial leadership services were an ideal fit for TS.  Using NC’s proprietary Numbers NavigatorTM financial platform, a financial scorecard is used to focus on measurements that drive company profits and cash flow critical to sustaining a business.  The scorecard offers the TS team an “at a glance” view of results.  The Number Navigator’sTM rolling financial forecast gives the TS team a tool to make critical decisions and see where they are headed financially. 

    Results

    NC pulled together financial and non-financial data to complete a scorecard, financial model, and supplemental reporting.  Each quarter NC meets with the TS team to methodically review results and provide input and analysis from the Numbers NavigatorTM.  From each Numbers Coach financial meeting, the TS team can take actions on activities that improve the company’s bottom line results.  Beine and his team can access the Numbers NavigatorTM at any time due to its cloud-based delivery platform.

    “Mike’s approach to coaching us on how to drive our financial results gives our team the right tools to help understand how to navigate our finances successfully and stay focused on our cash flow and investment goals.” 

    Charles Beine, Founder & CEO

    For more information on Thermal Support visit www.thermalsupport.com

    To learn more about the Numbers Coach financial leadership services, click here

    Filed Under: Case Study, Financial Modeling, Financial Reporting, Key Performance Indicators Tagged With: business financial planning, financial metrics, financial scorecard, key performance indicators

    Metric for Growth: Gross Profit Margin

    November 5, 2024 by Mike Iverson

    If a business owner had to manage by one single business metric, Gross Profit Margin (GPM) would be a solid choice.  It provides a good look at the important relationship between a business’s Sales and its Cost of Goods Sold. Understanding this relationship is critical to business success.

    The Calculation:
         Gross Profit Margin  =  (Net Sales – Cost of Goods Sold) / Net Sales


    (The calculation above uses numbers taken from an Income Statement. GPM is calculated as a ratio and is normally expressed as a percentage.)

    Why is GPM an important metric to follow?  Understanding your GPM is critical because it lets you as the owner know what it takes to be profitable after covering your other overhead costs that are not part of your Cost of Goods Sold in your GPM.

    Below is an example of a company that focused on improving its GPM from year to year. For 2011, its GPM was 49.6 percent. For 2013, the number increased to 51.0 percent. In just two years, the company improved GPM markedly. Had the company’s GPM remained static from 2011 to 2013 at 49.6 percent, Gross Profit for 2013 would have been lower by more than $102,000 lower.  

    Although incremental improvement to GPM can be difficult to achieve, when accomplished it is truly a gift that keeps on giving.  The $102,000 in higher profits (and cash flow) that Warning Lights of North Georgia achieved during the past two years should continue in future years.  Improving GPM might come from finding new and lower cost sources of raw materials or re-engineering processes—without harming product quality.

    Let’s do an example to illustrate the importance.  If your GPM percent is 40% and your overhead costs that you need to cover each month regardless of whether you sell anything is $100,000, then how much business do you need to generate just to breakeven for the month?

    If you don’t know the answer to this question, it could mean the difference between losing money or making money.  In our example above, it would require the business to generate $250,000 in revenue to cover its overhead costs.  How did we come to this conclusion?  Using the following formula:

    • $100,000 overhead cost / 40% = $250,000

    Keep a close eye on your GPM because it can make the difference between operating at a profit or at a loss.

    Here are some Numbers Coach tools to help you calculate your GPM:

    Tool kit

    “8 Essential Numbers” online course

    Filed Under: Blog, Business Growth, Financial Metrics, Financial Tools, Numbers Coach University Tagged With: financial leadership, financial metrics, gross profit margin, numbers coach

    The ABC’s of Financial Know-How

    July 11, 2024 by Mike Iverson

    As a business leader, you are barraged with endless acronyms for measuring the financial performance of your business, including NAV (net assets value), EPS (earnings per share), KPI (key performance indicator), ROI (return on investment), just to name a few. It can be overwhelming to know which acronyms are meaningful metrics for your business.

    The Numbers Coach recommends starting with two simple acronyms: ROA (return on assets) and ROE (return on equity). These metrics are simple yet effective indicators of the overall financial health of a business.

    Return on Assets

    ROA is a financial ratio that measures the profitability of a business in relation to its total assets. It is calculated by taking your company’s annual net income and dividing by its total assets including facilities, machinery, equipment, vehicles, inventory, etc. To put it simply, ROA shows how effective your company is at using assets to generate profit.

    Here’s an example: if your company’s net profit is $248 and the total assets in your business are $5193, divide 248 by 5,193 and you have a 4.8% return on assets.

    What is a good ROA? It’s usually the highest, but it depends on the industry. It is important to judge your business’s ROA against the competition. What is a great ROA in one industry may not be in another. Banks, for instance, bring in as much deposited money as possible and use it to offer loans at a higher return. They are known to have low ROAs versus a software company having a higher ROA. An ROA that is much higher than the industry norm may suggest the company isn’t renewing its assets for the future.

    Return on Equity

    ROE, or return on equity, is a similar calculation used to measure financial performance. To calculate ROE, net income is divided by average shareholders’ equity. ROE uses equity, the net worth of a company, not just what it owns. It tells businesses what percentage of profit they make for every dollar of equity invested in their company. In other words, ROEs show the return on a corporation’s profitability and how efficient it is at generating profits for the owners. Here, as with gross margins and net margins, the higher the numbers, the better.

    ROAs and ROEs are important tools used to indicate the financial success of a company over a specific time. If these financials are in order, they can be a relatively simple way to quickly demonstrate your company’s performance.

    Need some guidance for calculating and applying these metrics in your business? Contact the Numbers Coach for a free consultation.

    Filed Under: Blog, Financial Metrics, Financial Tools, Own Your Numbers Tagged With: financial management, financial metrics, profitability, return on assets, return on equity

    Want to Avoid Running Out of Cash? Know Your Working Capital Requirement

    April 10, 2024 by Mike Iverson

    Does running out of cash keep you up at night?  If so, you are not alone.  Many business owners and leaders report worrying about the amount of cash available in their businesses. 

    However, there is a way to measure how much money you need to operate your business without running out of money. It’s called the Working Capital Requirement (WCR).  By calculating the WCR, you will know how much cash you need to have readily accessible to sufficiently operate your business

    The calculation is as follows:

    Working Capital Requirement $= Cash Conversion Cycle (Days Receivable + Days Inventory – Days Payable) X Average Daily Sales (12 months sales / 365 days)

    This means that you need to keep access to cash in the bank, line of credit, credit cards and other financing sources equal to this number.

    For example, if Days Receivable is 30 days, Days Inventory is 45 days, Days Payable is 35 days, and annual sales are $1 million, then your working capital requirement would be: (30+45-35) X $2,739 ($1,000,000/365) = $109,600. Having this much access to ready cash will ensure you maintain day-to-day operations without running out of cash.

    What is your working capital requirement? Use our Tool Kit to help you calculate

    Need more guidance on how the WCR and other key metrics affect your business’s financial health? Schedule a free consultation with our Numbers Coach to discuss metrics that make sense for your business.

    Filed Under: Cash Flow Forecasting, Financial Metrics, Financial Tools, Numbers Coach TIPS, Own Your Numbers, Working Capital Tagged With: cash flow, financial metrics, working capital

    • 1
    • 2
    • 3
    • Next Page »
    NumbersCoach_Logo_green-gray_stacked

    Proud Supporter of

    Screenshot 2025-09-09 150120

    Get Financial Tips Delivered To Your Inbox

    Protect your business' financial health with our monthly financial tips.

    Contact Info

    P.O. BOX 250
    Decatur, GA 30031

    404-353-2148

    info@numberscoach.net

    © 2026 Trillium Financial, Inc
    Privacy Policy | Accessibility | Terms