NumbersCoach_Logo_Endorsed_UnderLogotype_2
  • Numbers Coaching
    • The Numbers Navigator®
    • Case Studies
  • About
    • Trillium-Numbers Coach Story
  • Resources
    • Blog
    • Numbers Coach TIPS
    • Podcasts
    • Numbers Coach Tools
  • Numbers Coach University
  • Contact
  • Search

Balance Sheet: The Second Half of Your Financial Story

November 14, 2023 by greenmellen

by Anne Moore Odell

A balance sheet shows you at a glance the financial health of a company at a specific moment. It illustrates a company’s assets, liabilities, and owners’ equity. Balance sheets help identify how well a company can meet its obligations and if it has room to grow.

Assets can be anything the business owns that has value to the business including cash, money markets, equipment, and accounts receivable. A liability, on the other hand, is a company’s accounts payables and other creditors’ claims.

A company’s balance sheet should be updated at least monthly. Key metrics on the balance sheet such as cash balances, receivables and payables should be monitored on a weekly or even daily basis. Together with income statements, balance sheets are the financial reports that banks, other lenders and investors need in order to know your credit worthiness.

“Business owners look at their balance sheet and their bank accounts and try to connect the dots,” says Mike Iverson, Numbers Coach. “But if you are preparing your income statement on a cash basis what you have in your bank accounts isn’t necessarily the profit you have coming from the income statement.”

Resources and Responsibilities

Assets on the balance sheet are generally listed in order of how easily they can be turned into cash, their “liquidity.” Cash-on-hand is therefore the most liquid of assets. Current assets are assets which could become cash in a year—for example, accounts receivable or inventory. Real estate and other investments, which would take longer to change into cash, are long-term assets and not easily liquidized.

Iverson explains, “A business generally has two key assets central to generating cash flow–accounts receivable and inventory. If you are a services business then accounts receivable is your main short-term cash flow asset. When you offer credit to customers, you have to remember you are really giving your customers an interest free short-term loan. It is the balancing act of making sure your customers pay you on time so you can pay your own bills on time. The longer your customer takes to pay you the more likely you will have difficulty in paying your own bills.”

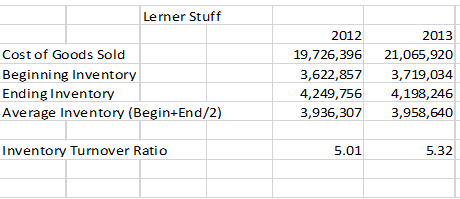
If your company has inventory, it is another key asset that needs to be carefully managed. “When businesses have inventory, it has generally been paid for and stored in a warehouse,” says Iverson. “The longer inventory sits in the warehouse, the more cash is tied up in this asset and not getting converted into sales and ultimately cash flow. You want to manage your inventory to the lowest level possible and still meet your sales needs.”

On the other side of the balance sheet are liabilities and owner’s equity. These include short-term or current liabilities accounts payable and notes payable which have to be paid in a year or less. Long-term liabilities are ones that will last longer than one year, for example, mortgage notes payable.

Owners’ equity, also called stockholders equity, is the money provided by the business owner and/or investors, plus retained earnings that have been put back in the business. Owner’s equity is a key number your banker looks at to see how much “skin in the game” the business owner has when evaluating credit worthiness.

Working Capital and Balance Sheet Pitfalls

Working capital is one measure used to know a company’s short-term health, and is calculated from information on the balance sheet. Working capital, also known as the “working capital ratio,” is the amount of cash that a company could generate in a short amount of time if necessary. A simple definition of working capital equals current assets minus current liabilities.

“It’s important to understand the quality of your working capital,” says Phil Poovey, a partner with Bridges & Dunn-Rankin, LLP, headquartered in Atlanta, GA. “If you have a lot of old accounts receivable that you aren’t likely to collect, you are fooling yourself to include them as current assets. Likewise, if you have excess inventory levels, you aren’t going to convert them to cash in a reasonable amount of time.”

Positive working capital is when assets outweigh liabilities. When liabilities outweigh assets, a business might have trouble paying its creditors and if cash can’t be found, bankruptcy declared. Comparing the working capital of a business from period to period helps business owners and investors see how effectively it can support sales growth, how efficient collections are and how quickly inventory is turning over.

Checks and Balances

As the economy struggles to right itself, smart businesses are examining their balance sheets with a magnifying glass to make sure they meet their obligations. “Many businesses are naturally adapted,” Poovey says. “Companies are being a lot more careful about whom they extend credit to. They are staying a lot closer to the clients they extend credit to.”

Poovey says that effective accounts receivable departments are not calling a month after a bill is due, but rather calling a week before the bill is due. Because as Poovey says, “a lot of times, the people who are more persistent are the people who get paid first.” It’s been said “the squeaky wheel gets the grease” so don’t be afraid to ask for your money.

It is important to realize that there are two sides to the story about cash and how much you get to keep in your bank account. Your income statement profit tells you how well you are managing your cash flow from operations and your balance sheet tells you how well you are managing your working capital needs—how quickly you are getting paid from your customers, how long you hold inventory, and how quickly you pay your vendors. All of these factors balance each other to let you know whether you have the money to continue growing your business.

Filed Under: Business Planning, Cash Flow Planning, Financial Modeling, Numbers Coach TIPS, Own Your Numbers, Working Capital Tagged With: assets, balance sheet, cash planning, financial management, financial metrics

Want More Cash Flow? Look At Your Inventory

October 12, 2023 by Mike Iverson

Have you ever been told your business made a nice net profit, but there is hardly any money in the bank account?

Cash flow for a business is more than just making a profit. If you have an inventory of products that you sell to your customers, then the amount of inventory you keep on hand and cycle through to sales will impact your cash flow. It’s one of the four pillars that drive cash flow (check out our articles on the other three: A/R, A/P and EBIDTA).

Maintaining a proper level of inventory is important to help sustain sales growth. However, too much inventory can lead to cash flow issues and restrict a company’s ability to meet its obligations. Customer buying patterns and other economic factors can all help determine how quickly you can cycle through your inventory.

Understanding how many days of inventory may you have on hand is an important measure for your cash flow. Knowing this metric can help you spot trouble where inventory in your warehouse may become obsolete.

How do I measure inventory cycle?

Below is a formula for calculating the number of days inventory on hand.

  • Formula
    • Cost of Goods Sold / 365 days= daily cost of goods sold
      • Inventory / daily cost of goods sold= days of inventory on hand
  • Example:
    • $500,000 / 365 days= $1,370 daily cost of goods sold
      • $75,000 / $1,370= 55 days of inventory on hand

In the above example, this company has approximately 55 days of inventory on-hand, or in other words, the company turns over inventory a little over 6 times a year.  This metric is dependent on many factors including supply chain constraints and vendor source opportunities.  The important fact is to measure this regularly to understand what it means to cash flow.

For instance, if the company reduces its days of inventory by 5 days down to 50 days, then it would have approximately $7,000 more cash in its bank account.  Managing inventory levels is as much an art as it is a science based on the numbers.  We don’t have a crystal ball to know how our customers might change their buying habits or when an economic event may occur that impacts our industry.  However, knowing how to measure our inventory in relation to how it impacts cash flow is important knowledge to make timely and reasonable decisions.

Do you know your inventory days on-hand?  If not you may find yourself asking the question of why you had such a profitable year, but you don’t have any cash left in the bank. Check out our downloadable template to help you measure this important metric. Let us know if you have any questions.

Filed Under: Cash Flow Forecasting, Cash Flow Planning, Financial Metrics, Numbers Coach TIPS Tagged With: cash flow, financial metrics, inventory

A Financial Dashboard Helps You Manage Your Business in Minutes

May 23, 2023 by Mike Iverson

There are many hats to wear when you own a business. One moment you’re a salesperson, the next you’re working on customer service or human resources. It comes with the territory.

But not all hats are equally comfortable. For many entrepreneurs, the financial management hat can be a tough fit. Why? Business owners have time limitations, and the time commitment for financial management can seem too great.

A good dashboard, however, can help make financial oversight of your business time-effective. You need only spend a few minutes weekly to have a good idea of where you stand.

Key Data at a Glance

Here is a dashboard that’s designed for a manufacturing operation. It focuses on just four pieces of basic financial information:

  • Sales
  • Cost of goods sold
  • Expenses
  • Profits

Let’s assume the business is the startup of a first-time business owner. The metrics are very simple. The graphical presentation is attractive. The dashboard provides real-time figures for the current month, as well as year-to-date performance. The first metric the owner sees on the dashboard is sales – arguably an important piece of information for a new business. The current month’s sales are broken down by product, so the owner can quickly check which products are selling well and which are selling poorly. Below the monthly sales total is a bar graph of the year’s trend, which shows steady progress. At the bottom of the column is a comparison against plan, which quantifies actual versus budgeted sales.

The purpose of the dashboard is to provide up-to-date information about the key performance metrics of the business. In just a few minutes, the owner can grasp the extent of the company’s sales success (or failure, as the case may be) with insight into the products and cost characteristics most responsible for the results. Spotting trends early can help a business owner make changes need to impact the financial results.

Tracking Your Key Metrics

The dashboard example provides some key metrics for a fledgling manufacturing company. But, what if your company provides professional services? Obviously, you need different metrics for your dashboard. Each business is unique, and the metrics tracked will vary from one business to the next.

Here are some of the key metrics Trillium Financial tracks for its clients:

Profit & Loss Metrics

  • Sales Growth
  • Gross Profit
  • Earnings Before Interest, Taxes, Depreciation and Amortization (EBITDA)
  • Net Profit
  • Fixed Overhead as a Percentage of Sales
  • Sales per Full-time Employee
  • Net Profit per Full-time Employee Equivalent

Balance Sheet Metrics

  • Days’ Sales Outstanding (collection cycle)
  • Inventory Turnover Rate
  • Days’ Payables Outstanding (payment cycle)
  • Debt-to-Equity Ratio
  • Current Ratio

Trend Metrics

  • Sales for Trailing 12 Months
  • Gross Profit for Trailing 12 Months
  • EBITDA for Trailing 12 Months

As you might imagine, an experienced business owner may know some of his financial ratios like the back of his hand. Even so, an owner should use a dashboard to track metrics that are important for their current financial management and most of all those metrics that drive cash flow. The metrics will likely change over time to add precision. For example, an experienced owner might know that overtime pay is the surest way to diminish the company’s profitability. Their dashboard tracks the average labor rate paid as a key business metric. A documented metric helps you spot trends that can create action.

A business may start out measuring a bunch of different metrics that are both financial and operational and eventually narrow the number of metrics down to those that are predictive and meaningful. I encourage you to develop a dashboard that helps you manage your business; after all, “What gets measured gets done.”

Let us know how we can help you develop a dashboard that works for your business.

Filed Under: Blog, Financial Metrics, Key Performance Indicators Tagged With: financial dashboard, financial metrics, metrics

Want To Stand On Solid Financial Ground?…Follow These 9 Key Strategies

April 28, 2023 by Mike Iverson

Don’t shoot yourself in the financial foot.  Stay clear of common financial mistakes by following these 9 financial concepts.

  • Cash is “king” so keep a handle on your cash by reviewing your cash flow statements, your weekly cash receipts, and weekly or daily cash balance.
  • Understand what would be the right mix of debt vs. equity in your business.  Each business has its own “speed limit” and growing too fast can cause you to pile on debt and thereby, risk to the business.
  • Have a written plan even if it’s a short one page which I prefer.  The lack of a plan is the plan to failure.
  • Know how to read your financial statements, and not just you profit and loss statement but also your balance sheet and cash flow statement.  Otherwise it will be hard for you to make good decisions for the business.
  • Know your costs.  This is especially true to understand at what point of your growth will you need to add more fixed cost to the business in order to go the next level.
  • Keep up good relationships with your bank and vendors.  These are your key stakeholders who can make the difference between success and failure.
  • Missing the “forest” because you are only looking at the “trees”.  You are missing the bigger picture of your business and industry.  Understand the trends and be able to step back from the business to see if you are driving in the right direction.
  • The absence of timely data from operations and finance.  If you are waiting 30 days or more to review this data, its most likely too late for good corrective action and rather you will be more in a reactive mode.
  • Lack of understanding the cause of the results.  Get to know the drivers of your business including your financial drivers.  These metrics will provide insight into the direction you are heading.

Follow these 9 key strategies and you will get the financial results that you want. Here’s to achieving your financial goals!

Mike

Filed Under: Business Growth, Cash Flow Forecasting, Cash Flow Planning, Financial Metrics, Financial Modeling, Key Performance Indicators, Numbers Coach TIPS, Working Capital Tagged With: business financial planning, financial accounting, financial education, financial management, financial metrics, KPI

Do You Have A Red Flag In Your Business?

April 26, 2023 by Mike Iverson

Small emerging growth companies often have limited resources and limited staff performing critical functions in accounting/finance.  Below is a list of tips that might indicate a closer look at your records for accuracy or the opportunity for fraud.

  • A spike in payroll expense without a reasonable explanation
  • Accounts receivable is growing but your sales are flat or down
  • Vendors who are being paid but you are not familiar with them
  • Human Resource records are minimal or non-existent for employee pay changes
  • Expense actual vs. budget shows a variance that is not reasonably explained
  • Prepaid expenses are growing consistently month to month but most expenses are flat or down in your income statement

I read an article recently where the same accountant who posted and deposited customer receipts had embezzled $126,000.  How?

The employee deposited customer checks to their ATM which is not always checked thoroughly the banking system.  The accountant then marked the corresponding invoice as “paid” and used the subsequent checks that came in for newer invoices.  This process could only go on for so long because the accounts receivable would grow from a larger pool of unpaid invoices.  Just as the accountant was about to leave the job, the embezzlement was discovered.

It was discovered by auditors checking on the cycle of a paid invoice; from receipt of check, to posting payment to the invoice, to depositing the check at the bank.  Some invoices shown as “paid” did not have a corresponding deposit.  Getting a copy of the deposited check from the customer revealed a different account number from the company’s account and discovered it was a personal account of the employee.

Here’s to a system of processes and activities that represents the phrase “trust but verify” to help you mitigate any circumstances where the health of your business is compromised!

Mike

Filed Under: Business Growth, Business Planning, Cash Flow Planning, Financial Metrics, Financial Modeling, Key Performance Indicators, Numbers Coach TIPS Tagged With: business financial planning, financial dashboard, financial education, financial metrics, financial reporting, key performance indicators, KPI

Measuring Your Performance

February 27, 2023 by Mike Iverson

One of the quotes that keeps coming back to me is “What gets measured gets done.” This simple mantra has held true for me both professionally and personally.  I sat down the other day to look at a set of goals that I had set 5 years ago.  I actually had forgotten about the document until I ran across it while cleaning out paperwork to start my new year.

It is amazing to see the power of writing down the goals and how they actually came true.  Not all of mine happened, but a good chunk of them did.  

Here were my goals:  

  • Take a family trip to Europe.  Checked that one off despite having three teenage girls going in multiple directions with their activities.   
  •  Expand our current home or find one more suitable. . . four years later, a more suitable house became available.
  • Be a part of a charitable foundation that gave back into my community…done, I began serving on the board of New American Pathways three years later.

For me the quote “from lips to pencil tips” says it all.  Once I write down the goal and use the SMART principles…accomplishment is not too far away.  SMART goals are: 

  • Specific
  • Measurable
  • Actionable
  • Realistic
  • Time bound

What are your goals?  Have you written them down?  Can you measure them? 

My challenge to you is to write down up to three goals you want to accomplish over 1, 2 or 3 years.  Check on them every so often, and then 4 or 5 years later you will see the power of performance measurement.

Here’s to achieving SMART goals!  

Mike

Filed Under: Key Performance Indicators, Leadership, Numbers Coach TIPS, Productivity Management Tagged With: financial dashboard, financial management, financial metrics, financial reporting, key performance indicators

What Your Inventory Turnover Ratio Is Telling You

May 6, 2022 by greenmellen

Bankers who lend to small businesses in manufacturing and distribution often calculate a client’s inventory turnover ratio. “What are the bankers looking for in a ratio?” clients sometimes ask.

First, bankers wonder whether the business is carrying inventory that is disproportionate to its sales. Carrying excess inventory is not a productive use of capital when money is tied up in product that sits on a shelf and incurs warehouse costs.

A second concern for lenders is that inventory not turned over quickly will become obsolete, damaged, or outdated. In any of those circumstances, revaluation of the inventory is necessary and losses must be booked. That’s a concern to lenders.   Also a decreasing turnover rate could indicate a slowing sales and lower profit trend.

Calculating the Ratio

The ratio is only difficult to calculate if a business’s inventory varies significantly throughout the year. Inventory Turnover is calculated as Cost of Goods Sold divided by Average Inventory. The Cost of Goods Sold is always calculated for the Income Statement, so the figure is readily available. Average Inventory may be trickier. For businesses with fairly constant inventory levels, simply add Beginning Inventory to Ending Inventory and divide by two to calculate a simple average.

This simple average doesn’t always work well, however, because many businesses have significantly less inventory at the beginning and end of the year than at other times. The simple average, therefore, uses an artificially low denominator, which tends to overstate the Inventory Turnover Ratio.  So, if monthly inventory figures are available to calculate the average their use will provide a truer Inventory Turnover Ratio:

Using information from the table above, we can calculate Lerner’s Inventory Turnover Ratio for 2012 and 2013. The ratio is determined by dividing Cost of Goods Sold by Average Inventory for each year. For 2012, the calculation is 19,726,396/3,936,307=5.01. For both 2012 and 2013, Lerner turned over its inventory slightly more than five times per year. Bankers interested in Lerner’s Inventory Turnover Ratio would likely compare the Lerner ratio against those of other companies in the same industry. A turnover ratio significantly below those of Lerner’s peer group might cause bankers concern about inventory obsolescence.

Let us know if you would like to see how your ratio stacks up against those of your peers, or to discuss how to improve your ratio.

Filed Under: Business Growth, Business Planning, Cash Flow Planning, Financial Modeling, Key Performance Indicators, Numbers Coach TIPS, Rolling Financial Forecast, Working Capital Tagged With: cash flow forecast, cash forecasting, cash planning, financial metrics, inventory management, inventory turnover, key performance indicators, KPI, preserving cash, working capital management

The Numbers Coach Builds Financial Blueprint for Sustainability Company to Grow

October 28, 2021 by greenmellen

The Company

Sustainable Investment Group (“SIG”), founded by Charlie Cichetti and Jason Kiefer, provides sustainability services to commercial property owners. SIG provides high quality services for LEED certification with commercial buildings. A LEED certified building ensures the property uses sustainable activities to help protect our environment. SIG offers LEED training, consulting, and engineering services domestically and internationally. SIG has become an industry leader and expert in LEED practices.

Situation

In 2020 the SIG team wanted to enhance their financial management and reporting. They were looking to create a platform to communicate the company’s key performance indicators (“KPIs”) that drive its financial results. In addition, the SIG team wanted a “road map” that could guide them as they made financial decisions impacting strategies for growth.

Solution:  Numbers Coach Leadership and Numbers Navigator Services

The Numbers Coach‘s financial leadership services, led by Mike Iverson, were an ideal fit for developing SIG’s performance metrics. Iverson developed a financial scorecard focusing financial drivers that give the team visibility into the profits and cash flow critical to sustained profitable growth. The scorecard offers an “at a glance” view of results. Using our proprietary software (the Numbers NavigatorR), the Numbers Coach plan provided the road map for the SIG team to see where they were headed with profits and cash flow. The model provides a rolling forecast during the year so that the SIG team could make financial and operational decisions “on the go” to achieve their goals.

Results

Iverson pulled together financial and non-financial data to complete a customized scorecard and financial model. Each month, the Numbers Coach meets with the SIG team to methodically review results and provide the input and analysis from the Numbers NavigatorR software. From the monthly financial coaching meetings, the SIG team can take actions on activities that improve the company’s bottom line results.

For more information on Sustainable Investment Group visit www.sigearth.com

To learn more about Numbers Coach services, click here

“Mike has been an important part of our team.  His understanding of financial processes, cash flow, and how to explain our results gives our team the right tools to navigate our finances successfully and stay focused on our financial goals.”  

– CHARLIE CICHETTI

Filed Under: Business Growth, Business Planning, Case Study, Financial Metrics, Financial Reporting, Key Performance Indicators Tagged With: blueprint, financial management, financial metrics, financial reporting, key performance indicators, KPI, numbers coach

Numbers Coach Eases the Pain of Financial Management for Medical Practice

March 23, 2021 by greenmellen

The Company

Pain Care, LLC (formerly Georgia Pain and Spine Care) is a leading pain management medical services firm that provides comprehensive solutions to help restore each patient to their original lifestyle. The company uses progressive approaches to pain management with education, counseling, and minimally invasive procedures. Their mission is to relieve pain, increase productivity, and improve the quality of life for its patients using technologically advanced treatment regimens through its various metro Atlanta offices.

Situation

In 2020, the Pain Care team wanted to enhance their financial management and reporting capabilities. They wanted to create a platform to communicate the company’s key performance indicators (“KPI”) and help educate its key team members on what drives its company’s financial results. In addition, the Pain Care team wanted a “road map” that could guide them as they made financial decisions impacting strategies for growth.

Solution:  Numbers Coach Leadership and Numbers Navigator™ Services

The Numbers Coach (“NC”) financial leadership services were an ideal fit for developing Pain Care’s performance metrics. NC developed a financial scorecard to focus on the financial measurements that drive company profits and cash flow critical to sustained profitable growth. The scorecard offers an “at a glance” view of results. NC developed a financial model from its proprietary software, the Numbers Navigator™ . The software provides a road map for the Pain Care team to see where they are headed with profits and cash flow. The software’s rolling financial forecast provides the Pain Care team with a tool to make critical decisions “on the go” to achieve their desired results.

Results

NC pulled together financial and non-financial data to complete a scorecard and financial model. Each month NC meets with the Pain Care team to methodically review results and provide the input and analysis from NC’s Numbers Navigator™ financial software. From the monthly financial coaching meetings, the Pain Care team can take actions on activities that improve the company’s bottom line results.

For more information on Pain Care, LLC visit www.georgiapaincare.com

To learn more about the Numbers Coach financial leadership services, click here

“Mike has become an important part of our team.  His understanding of financial processes, cash flow, and approach to educating us on our results gives our team the right tools to help us understand how to navigate our finances successfully and stay focused on our financial goals.”  

Dr. Charles Brownlow, Founder / Medical Director

Filed Under: Business Growth, Business Planning, Case Study, Cash Flow Planning, Financial Metrics, Financial Modeling, Key Performance Indicators Tagged With: business financial planning, business strategic planning, business strategy, company strategy, financial dashboard, financial education, financial management, financial metrics, key performance indicators, KPI

Why a Slow Economy Doesn’t Have to Mean Dire Straits for Your Business

May 13, 2020 by greenmellen

Is the slowing economy adversely affecting Atlanta’s businesses, or is it a great time to be in business?

Well that depends mostly on your recent revenues. But even if those are in reverse, a slowing economy can be a great time to take advantage of some opportunities and position your business to come out of the gate at full speed when the economy takes an upswing.

We wanted to hear what local professionals in finance and business had to say about the current state of affairs. CFO service provider Mike Iverson and Vistage Chair Tim Fulton had some good tips for bad times.

Cash is King

The first step to understanding how to make sure your glass is half full is to assess your financial situation and understand exactly how much cash and credit you have. Even if cash flow is good, “Now would be a good time to go the bank,” says Mike Iverson, CPA and Principal of Trillium Financial, “before the economy gets worse or your company financials get worse. Go to the bank and make clear why you want a line of credit and what you will use it for.” It’s important to be proactive when it comes to having the cash stores ready. If you wait until you need it, your statements probably won’t look as good, and the bank may decline a loan or line of credit. Planning ahead is always a good thing. “The key to survival in an economic downturn is to out perform the market, and accumulate cash”, says Tim Fulton, a Vistage International Group Chair which works with over 14,000 chief executives in 16 countries.

Another aspect of understanding your capital position is modeling. How long can your business last with a certain amount of decline? What will you do to make sure you can weather the storm and start growing again? Imagine the various scenarios – even the truly ugly ones – and devise solutions before they come to fruition. You’ll be able to think more clearly in the face of adversity if you have a battle plan and, again, a line of credit to back you up. This doesn’t mean that you have to focus on the worst case scenario, just plan for it, then focus on your everyday business.

Modeling the tough situations is especially important if you are in a cyclical business; for example, the automotive industry. When the economy hits the skids, the average car dealership will probably see sales decline rapidly. Managers must have enough cash reserves to ride out the storm, and to pay for overhead and inventory so they can still be in business a year from now.

If you are a manufacturer, or a company that manages a lot of inventory, be mindful of your production capacity. You don’t want to continue to run at full capacity and end up with an overstock. Go to your clients and continually measure what they anticipate ordering from you in the next two to three months. For production purposes, you might have to scale back so the inventory on hand can be used, and not end up obsolete. On the positive side, manufacturers are usually the first to see orders are picking up. They’re not necessarily the canary in the mine shaft, but these businesses tend to provide a leading indicator.

The Positives of Slower Times

Once your cash situation is well-positioned, the glass is definitely half full. Now is the perfect time to expand your business through capital investments such as acquiring a struggling competitor. You can often take advantage of businesses being sold at fire-sale prices.

“When the economy bottoms out, there will be an abundance of great investment opportunities,” says Fulton. “The business owner with cash will be in a strong position to take advantage of these opportunities.”

Companies with cash can also get the upper hand over competitors by investing in the introduction of new products and in new technology that other business can’t afford. “If you can do any of these things”, says Iverson, “you’ll be in a different place than your competitors because you will be nine to twelve months ahead of them.  You will have something to offer customers that your competitors cannot.”

Companies who differentiate themselves in this way will be growing when everyone else is declining. Constantly look at opportunities to grow with products and services that will serve others struggling with hard economic times and continue to help them through good economic times,” says Iverson.

Another way to grow through a slowing economy is to ramp up marketing. While other companies cut their marketing budgets, Fulton recommends against this instinct. “Be very, very focused in your marketing strategies. This is not a time to be spending a lot of money on broad branding efforts. It is a time to be laser-focused on acquiring new clients and retaining profitable existing clients,” he says.

Iverson agrees. “Marketing is the last place you should cut back,” he says. “Marketing initiatives are priming the pump to create your sales engine. If you cut back on that, you cut back on future sales and opportunities. If everyone else cuts back on marketing, you will stand out even more, possibly turning that half-full cup to overflowing.”

Filed Under: Blog, Business Growth, Business Planning, Cash Flow Forecasting, Cash Flow Planning, Employer Tips, Financial Metrics, Financial Modeling, Own Your Numbers, Rolling Cash Flow Forecast, Rolling Financial Forecast Tagged With: business financial planning, business planning, business strategic planning, cash flow forecast, cash forecasting, cash planning, financial analysis, financial habits, financial management, financial metrics, strategic planning

Keep the Boat Afloat: Strategies for Securing Your Finances Through A Global Pandemic Storm

April 13, 2020 by greenmellen

By Michael Iverson

We are in an unprecedented time – one that is impacting most businesses in the United States and the world. And there’s no telling what the fallout will look like or even how long social distancing and company shutdowns will continue.

As a numbers coach for my business clients, many of them are asking for advice and guidance during this volatile and unpredictable time. I assure them that as a business owner or leader, a number of financial factors remain under their control. Here’s what I’m emphasizing:

Lead where you can: Communicate and Be Flexible

Change and uncertainty are all around us right now: How long shutdowns and isolating will last, the long-term macro- and micro-economic impact of this crisis on businesses, families, and communities around the world, or whether people will regret buying a year’s worth of toilet paper are unknown. We have little to no control over most of this.

What you can control is how you react.

No one knows exactly what to do – and that’s OK. Your strategic decisions can keep your company afloat through this crisis.

Communication: Transparent and honest communication isn’t a new concept, but it is more important now than ever. Explain to employees, customers, and other stakeholders that, like everyone else, your business is experiencing the ramifications of the coronavirus. Explain your challenges and your high-level strategy to overcome them. Everyone is more likely to empathize if you communicate honestly and authentically. The health and safety of your employees is the most important priority.

Keep the communication flowing – ask where they’re struggling the most, and where you can help. Offer a free brainstorming session. Remember – your goal is to maintain the relationship so it can grow after this crisis passes.

Flexibility:  As you’re asking for flexibility from your clients and employees, consider offering some in return. I always encourage my clients to have a 3- to 6-month cash reserve. Times like these are why you held that money. Offer customers a modified payment plan or if you can relax payment terms for products or services like ongoing license support or maintenance.

For employees, be flexible with time, productivity and deliverable expectations. People’s daily lives have been upended, from homeschooling and supervising children to caring for sick family members. And for the most part, they want to do their best for you while figuring out their situation. Consider staggered or flexible work schedules. Relax deliverable dates where possible.

If you have employees with a lighter workload during this time, give them the opportunity to shine when others are overwhelmed. Maybe ask for a volunteer to provide updated COVID-19 information both medical and financial. Dedicate someone to helping employees take advantage of cost- and time-saving benefits such as telemedicine, wellness programs, and EAP offerings.

But also remember as crucial as communication is, too much information, repeating the same message with minor tweaks, or asking employees to be constantly online or send hourly updates are all examples of actions that could provoke burnout and deeper anxiety. Remember, we’re all getting corona-related messages from companies we haven’t heard from in years. We’re all figuring out this out together. Don’t unnecessarily add to the cacophony.

Pivoting to new operational models

With office and business closures, we’ve shifted to working almost entirely online. Engage customers and prospects virtually through platforms like WeChat, Zoom, Skype. For those with whom you haven’t engaged with this way, the novelty may actually open doors. Use email lists and social media analytics to reach new leads. Try apps like Trello or Monday or dig out that intranet project you’ve been putting off, to organize and detail projects so everyone is working together.

Prioritize initiatives that require less capital, less risk, and have a proven positive impact on cash flow. It is possible to continue to operate debt free and maintain access to capital. For more cash preservation guidance, check out the “Preserving Cash in Uncertain Times” article I published last week.

If your company’s situation is looking dire and you’re considering layoffs, consider looking into a four- or even three-day work week to reduce costs. If employees are sitting on the bench due to loss of client work or decrease in demand, ask if they could use their PTO now or agree to work half time or take unpaid leave. Look into emerging government programs to cover salaries. The Cares Act is landmark legislation passed on March that has several key programs:

  • Paycheck Protection Program Loan with a forgiveness provision
  • Economic Injury Disaster Loan program as part of the Small Business Administration
  • Employer 6.2% payroll tax deferral program
  • The Unemployment supplemental insurance program

The following link provides more detail on the programs and what is offered:  COVID-Bill-3-Summary

If you need to consider across-the-board pay cuts, keep them in direct relation to job positions. Start first with voluntary cuts. Some employees are looking for ways to help others who can’t afford a pay cut. For example, the CEO should lead by example and take the largest pay cut, the highest paid employees take the next highest cut, and so on down the line.

Finally, if you haven’t already, postpone all travel and make every effort to allow employees to work from home.
Negotiate with vendors, who are undoubtedly making changes of their own. Look for extraneous expenses to eliminate, and lower cost alternatives to conventional advertising. Look into whether your insurance coverage can help. Leave no stone unturned when looking at ways to conserve cash.

Learn, grow, breathe. We’ll get through this!

It may be the last thing you want to think about, but now is the time to take note of practices that will prevent repeating mistakes in the future.

Take notes. If you didn’t have a solid disaster recovery plan ready this time, prepare one for the future using knowledge you acquired during the COVID-19 pandemic.

And no matter how brilliant and detailed your plan is, expect things to continue to go awry. When this happens, stop, take a few deep breaths, remember your training, focus on the end goal, and make the most rational decisions possible.

If you’re looking for more guidance, I’m happy to talk. Give me a call at (404) 353-2148 or email me. I’m here to help.

With hope, gratitude, and cooperation, it won’t be long before we turn our TVs, smart phones, and laptops on and see nary a mention of pandemics.  Until then, stay safe and be well!

Filed Under: Blog, Business Planning, Cash Flow Forecasting, Cash Flow Planning, Employer Tips, Financial Metrics, Financial Modeling, Rolling Cash Flow Forecast, Rolling Financial Forecast Tagged With: business financial planning, financial analysis, financial crisis management, financial education, financial habits, financial leadership, financial management, financial metrics

Keep Your Finger on the Pulse of Your Business

September 11, 2019 by greenmellen

There are plenty of ways to measure the financial success of your business: profit margins and revenue growth, for instance.  But do the old standby measures give you the whole picture? It’s never too early or too late to try out new ways of analyzing the financial health of your business.

I recently came across a 2017 Inc. magazine article written by entrepreneur and author Norm Brodsky. In “Pencil Power” he suggests an assessment method that would have been called “old fashioned” in the past, but today might be termed “retro.”  It involves—brace yourself—a pencil and paper.  (Yep, I’m coming back to the same pencil and paper I mentioned in a blog post a few months ago.)  Brodsky believes that tracking monthly sales and gross margins by hand is especially beneficial to new, or relatively new, business owners.

He says the practice will improve young businesses’ chances of success 100 times over:

“By writing the numbers down and doing the calculations yourself, you begin to have a feel for the relationships between them. Later on, when other people are reporting numbers to you, you’ll be better able to recognize when something’s wrong.”

Brodsky recommends a simple exercise to try at the end of each month: write down sales, cost of goods, gross profit, and gross margin of each product for both the month and year-to-date. Then write down the same information for each customer.  This is a quick way to see where you are saving money and where you aren’t.

If your business is already doing a good job tracking these metrics, there might be others that could shine light on an area that’s erratic or negatively trending. Try writing down monthly inventory holding costs or Accounts Payable and Accounts Receivable totals. Maybe some cash flow metrics need attention.

It’s a painless, 30-minute exercise that just might surprise you by exposing a weak or strong area of your business that’s been hiding in the dark. Add it to your evaluation and decision-making arsenal. I suspect you’ll find it insightful.

Let us know if we can help you track your metrics.

Filed Under: Business Planning, Employer Tips, Financial Metrics, Financial Modeling, Key Performance Indicators, Leadership, Numbers Coach TIPS, Productivity Management Tagged With: business financial planning, financial dashboard, financial education, financial habits, financial leadership, financial management, financial metrics, key performance indicators, KPI

  • « Previous Page
  • 1
  • 2
  • 3
  • Next Page »
NumbersCoach_Logo_green-gray_stacked

Proud Supporter of

Screenshot 2025-09-09 150120

Get Financial Tips Delivered To Your Inbox

Protect your business' financial health with our monthly financial tips.

Contact Info

P.O. BOX 250
Decatur, GA 30031

404-353-2148

info@numberscoach.net

© 2026 Trillium Financial, Inc
Privacy Policy | Accessibility | Terms