NumbersCoach_Logo_Endorsed_UnderLogotype_2
  • Numbers Coaching
    • The Numbers Navigator®
    • Case Studies
  • About
    • Trillium-Numbers Coach Story
  • Resources
    • Blog
    • Numbers Coach TIPS
    • Podcasts
    • Numbers Coach Tools
  • Numbers Coach University
  • Contact
  • Search

Understanding Your Cash Conversion Cycle

May 14, 2026 by greenmellen

For small businesses, cash flow is one of the most important determinants of business success.  There are many metrics used to monitor cash flow, one of which is the Cash Conversion Cycle (CCC). We coach all of our clients to track CCC as a key metric.

The CCC measures a company’s effectiveness at converting its investment in inventory into cash. The cycle typically involves purchasing inventory inputs on credit (Accounts Payable), selling the inventory through sales on credit (Accounts Receivable), and converting inventory back into cash. The lower the number of days in the CCC, the more effective management is at generating cash flow from the sale of its product or service.

How the Cash Conversion Cycle Is Calculated

The formula is comprised of three figures.
•    Number of “Days Inventory On Hand” (DIO)
•    Number of “Days Sales Ooutstanding” (see article on DSO here)
•    Number of “Days Payable Outstanding” (DPO)

The formula for calculating the Cash Conversion Cycle (CCC) is:

CCC = DIO + DSO – DPO

DIO, DSO and DPO represent the three component stages of the conversion cycle.  For a service company the cycle would only include the DSO and the DPO metrics.

Breaking It Down

Let’s look at each stage of the CCC to understand the relationships:

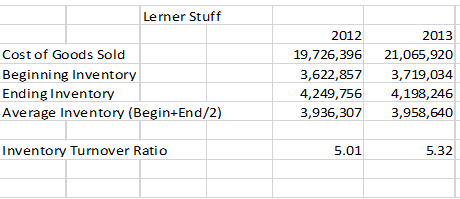
  1. The DIO stage measures the time (in days) required to turn over one complete inventory.  DIO can be calculated using figures taken from the annual financial statements; Inventory from the balance sheet and Cost of Sales from the income statement. It is calculated as:
    DIO = Inventory /Cost of Sales x 365
    The idea is to minimize the DIO by turning over inventory as quickly as possible. Selling inventory converts the owner’s investment in inventory into Accounts Receivable, or directly into Cash in the case of cash sales at a retail store.
  2. The DSO stage measures the number of days needed to collect the Accounts Receivable. Using the Accounts Receivable figure from the year-end balance sheet and the Net Credit Sales from the annual Income Statement, it is calculated as:
    DSO = Accounts Receivable/Net Credit Sales x 365
    Like DIO, a business owner wants to minimize DSO. DSO measures how quickly the business is able to convert a credit sale into cash.
  3. The DPO stage measures the number of days it takes to pay vendors for the inventory purchased or expenses incurred to deliver your product or services. Using the Accounts Payable figure from the year-end balance sheet and the Cost of Sales from the Annual Income statement, it is calculated as:
    DPO = Accounts Payable/Cost of Sales x 365
    In contrast to the DIO and DSO stages, business owners want to maximize DPO. A business improves its cash position by holding onto cash longer. Cash flow benefits, of course, must be carefully measured against a company’s payment terms with vendors.  Its important to maintain good relationships with your vendors because they help you grow your business.

The Cash Conversion Cycle metric is most useful in comparing a company’s cash flow performance this year against the performance in previous years, or against competitors’ performance.   By monitoring the trends of the CCC metric, you can spot potential cash flow issues before they become a crisis.

Filed Under: Blog, Cash Flow Forecasting, Cash Flow Planning, Financial Metrics, Financial Modeling, Key Performance Indicators Tagged With: business financial planning, cash flow forecast, cash forecasting, cash planning, preserving business cash, preserving cash, uncertain cash flow

Numbers Coach Identifies Opportunities for Improved Cash Flow for Environmental Engineers

April 21, 2026 by greenmellen

THE COMPANY

In 1996, Scott Pate launched Sierra Piedmont (“SPI”) with a vision to create a superior environmental consulting, site assessment, compliance, and remediation services firm. Since then, SPI has served a wide range of companies from Fortune 100 businesses to regional firms throughout the United States. SPI’s innovative solutions and advice have helped its clients solve their environmental issues.

SITUATION

Pate and SPI’s management team wanted to realize improved cash flow in their day-to-day operations. However, they were not clear on which financial metrics were truly driving the business and needed more meaningful insights beyond the Profit & Loss statement.

SOLUTION: The Numbers Navigator™

SPI hired the Numbers Coach to provide a comprehensive analysis of its financial operations.The Numbers Coach (“NC”) uses its proprietary Numbers Navigator™ tool set to determine the key financial drivers in SPI’s business model. NC gained a further understanding of SPI’s key business issues through a discovery session with management. NC provided Pate and his team with a comprehensive financial report that identified opportunities to drive more cash flow from the business.

RESULTS

Together, NC and SPI determined realistic and actionable strategies to realize improved cash flow quickly. To achieve this goal, NC provided:

  • A 20+ page financial report detailing key drivers in SPI’s business model,
  • A systematic cash flow forecasting model to provide SPI visibility into its future cash flow,
  • “What if” scenarios analyzed to understand the impact of different financial strategies,
  • Establish guiding principles for disciplined cash flow management process
  • A short-term planning tool to ensure resources and cash were allocated appropriately

“Although it sounds cliché, Numbers Coach and the Numbers Navigator™ truly changed our financial life!” explains Pate.  “The fact is, for many years we had little or no ability to perform high level “what-ifs” or projections of cash effects based on pulling different levers in the company.”

“I don’t know of another program quite like this one,” says Pate. “It doesn’t seem boilerplate or ‘canned.’  I think the most benefit is received by using the Navigator in conjunction with Numbers Coaching services to understand how to apply what is revealed by the report to our financial metrics.”

To learn more about Sierra Piedmont, visit www.sierrapiedmont.com

To learn more about the Numbers Coach financial leadership services, click here

Filed Under: Case Study, Cash Flow Forecasting, Cash Flow Planning, Financial Modeling, Financial Tools, Numbers Coaching Tagged With: cash conversion cycle, cash flow forecast, cash forecasting, cash planning, financial analysis, financial education, financial leadership, financial management

Head off Financial Stress with a 90-Day Cash Flow Forecast

March 4, 2026 by greenmellen

Short-term cash flow challenges are very common among small businesses. When a business responds poorly to a cash flow challenge, its ability to continue operations may be jeopardized. Unfortunately, a poor reaction to a cash flow challenge is what often happens.

A common approach is for a business with tight cash flow to monitor its cash balance daily and estimate accounts receivable for the next several weeks. The problem with that approach is that it doesn’t help you as the owner prepare for a cash crunch due to hit four to twelve weeks in the future. That’s why we recommend clients use a 90-day cash flow forecast.

Rolling 90-Day Forecast

The surest way to avoid an unpleasant cash flow surprise is to use a 90-day rolling cash flow forecast. The forecast usually takes the form of an Excel spreadsheet that shows the expected weekly cash receipts and payments. These are presented line by line and tracked weekly.

To create the forecast requires beginning cash balances, estimated cash receipts, estimated payroll and taxes, estimated operating expenses, payments coming due on notes and leases, and lines of credit.

Creating and updating a 90 day cash flow forecast provides numerous benefits:

  • Visibility into your short-term cash needs
  • Financial discipline in measuring your inflows and outflows of your business; i.e., “What gets measured, gets managed.”
  • Insights into your operations and its short-term flow of activities

Estimating Cash Inflows and Outflows

Inflows

Estimating cash receipts for a 13-week period is one of the more difficult components of the model.  Whether your customers pay in a timely manner is typically a function of their own cash flow positions.  Don’t be deterred from making your best estimates, knowing that actual receipts will differ from your estimates. Use recent payment performance of each customer as a guide.

Depending on the number of customers involved, you may want to create a line on the spreadsheet for your largest customers to identify their specific collection pattern independent of the rest of your customers. Alternatively, if your customer base has numerous small customers, you may want to create a separate tab that provides a general pattern of collection from your monthly sales.

Outflows

Payroll and related taxes are generally easier to estimate because for most businesses, the figures may not change much week to week or they change in a predictable manner. Payrolls that include commissions are more difficult to estimate.  One way to estimate commission would be to obtain a historical trend of commission expense as a percent of sales. Then using this percent apply it to the collected sales or billed sales (whichever the commission is based on) subject to commission and put the amount in the period you expect to pay it.

Cash outflows for accounts payable and operating expenses can be easier to forecast.  We recommend laying out the general timing of when you typically pay an expense. For example, office rent is typically due on the 1st of each month.  In this case, you may show the payment as an outflow in the last week of the prior month to ensure the check arrives on the due date.  If you see headwinds ahead in your cash flow, keep your vendors apprised of your ability to pay and reward their patience as best you can.

Stay in Control of Cash Flow

Business conditions change quickly today.  Keeping a tight rein on cash flow is a small business survival skill and the life blood of a company. The 90-day rolling forecast is a good tool that can help you stay in control of your cash flows. For a forecast to be accurate and relevant, it should be monitored on a regular basis and updated with forecast compared to actual. See where the differences occur and adjust your forecasting for any trends that you see. When the forecast is used this way, it becomes a tool for active management of a business’s cash position.

If you need help putting together your forecast, contact us or check out our Cash Flow Tool Kit

Filed Under: Blog, Business Planning, Cash Flow Forecasting, Cash Flow Planning, Financial Modeling, Rolling Cash Flow Forecast Tagged With: cash flow, cash flow forecast, cash forecasting, cash planning, financial management

Balance Sheet: The Second Half of Your Financial Story

November 14, 2023 by greenmellen

by Anne Moore Odell

A balance sheet shows you at a glance the financial health of a company at a specific moment. It illustrates a company’s assets, liabilities, and owners’ equity. Balance sheets help identify how well a company can meet its obligations and if it has room to grow.

Assets can be anything the business owns that has value to the business including cash, money markets, equipment, and accounts receivable. A liability, on the other hand, is a company’s accounts payables and other creditors’ claims.

A company’s balance sheet should be updated at least monthly. Key metrics on the balance sheet such as cash balances, receivables and payables should be monitored on a weekly or even daily basis. Together with income statements, balance sheets are the financial reports that banks, other lenders and investors need in order to know your credit worthiness.

“Business owners look at their balance sheet and their bank accounts and try to connect the dots,” says Mike Iverson, Numbers Coach. “But if you are preparing your income statement on a cash basis what you have in your bank accounts isn’t necessarily the profit you have coming from the income statement.”

Resources and Responsibilities

Assets on the balance sheet are generally listed in order of how easily they can be turned into cash, their “liquidity.” Cash-on-hand is therefore the most liquid of assets. Current assets are assets which could become cash in a year—for example, accounts receivable or inventory. Real estate and other investments, which would take longer to change into cash, are long-term assets and not easily liquidized.

Iverson explains, “A business generally has two key assets central to generating cash flow–accounts receivable and inventory. If you are a services business then accounts receivable is your main short-term cash flow asset. When you offer credit to customers, you have to remember you are really giving your customers an interest free short-term loan. It is the balancing act of making sure your customers pay you on time so you can pay your own bills on time. The longer your customer takes to pay you the more likely you will have difficulty in paying your own bills.”

If your company has inventory, it is another key asset that needs to be carefully managed. “When businesses have inventory, it has generally been paid for and stored in a warehouse,” says Iverson. “The longer inventory sits in the warehouse, the more cash is tied up in this asset and not getting converted into sales and ultimately cash flow. You want to manage your inventory to the lowest level possible and still meet your sales needs.”

On the other side of the balance sheet are liabilities and owner’s equity. These include short-term or current liabilities accounts payable and notes payable which have to be paid in a year or less. Long-term liabilities are ones that will last longer than one year, for example, mortgage notes payable.

Owners’ equity, also called stockholders equity, is the money provided by the business owner and/or investors, plus retained earnings that have been put back in the business. Owner’s equity is a key number your banker looks at to see how much “skin in the game” the business owner has when evaluating credit worthiness.

Working Capital and Balance Sheet Pitfalls

Working capital is one measure used to know a company’s short-term health, and is calculated from information on the balance sheet. Working capital, also known as the “working capital ratio,” is the amount of cash that a company could generate in a short amount of time if necessary. A simple definition of working capital equals current assets minus current liabilities.

“It’s important to understand the quality of your working capital,” says Phil Poovey, a partner with Bridges & Dunn-Rankin, LLP, headquartered in Atlanta, GA. “If you have a lot of old accounts receivable that you aren’t likely to collect, you are fooling yourself to include them as current assets. Likewise, if you have excess inventory levels, you aren’t going to convert them to cash in a reasonable amount of time.”

Positive working capital is when assets outweigh liabilities. When liabilities outweigh assets, a business might have trouble paying its creditors and if cash can’t be found, bankruptcy declared. Comparing the working capital of a business from period to period helps business owners and investors see how effectively it can support sales growth, how efficient collections are and how quickly inventory is turning over.

Checks and Balances

As the economy struggles to right itself, smart businesses are examining their balance sheets with a magnifying glass to make sure they meet their obligations. “Many businesses are naturally adapted,” Poovey says. “Companies are being a lot more careful about whom they extend credit to. They are staying a lot closer to the clients they extend credit to.”

Poovey says that effective accounts receivable departments are not calling a month after a bill is due, but rather calling a week before the bill is due. Because as Poovey says, “a lot of times, the people who are more persistent are the people who get paid first.” It’s been said “the squeaky wheel gets the grease” so don’t be afraid to ask for your money.

It is important to realize that there are two sides to the story about cash and how much you get to keep in your bank account. Your income statement profit tells you how well you are managing your cash flow from operations and your balance sheet tells you how well you are managing your working capital needs—how quickly you are getting paid from your customers, how long you hold inventory, and how quickly you pay your vendors. All of these factors balance each other to let you know whether you have the money to continue growing your business.

Filed Under: Business Planning, Cash Flow Planning, Financial Modeling, Numbers Coach TIPS, Own Your Numbers, Working Capital Tagged With: assets, balance sheet, cash planning, financial management, financial metrics

Want More Cash Flow? Check your Accounts Payable Cycle

May 4, 2023 by Mike Iverson

Understanding the levers that drive your company’s cash flow can be the difference between staying in the game or closing up shop. A business can have positive net income, but still come up short of the cash it needs to keep the doors open.

One of those metrics that can cause a lack of cash is your accounts payable collection cycle. It’s one of the four key pillars that drive cash flow.

Accounts Payable Cycle

Some company’s vendors offer the ability to buy their products or services and pay them later. Offering this credit is like getting a short-term interest free loan from the vendor. As part of the deal, your vendor will want to get paid back based on the payment terms they offered. Understanding how long it takes for you to pay vendors is critical to your cash flow.

How do you measure it? Below is a formula that calculates your accounts payable days to pay cycle. Like the accounts receivable collection cycle, this calculation is based on a “snapshot in time” and you will want to monitor it on a regular basis such as monthly.

Formula:

Total expenses / 365 days= daily expenses
Accounts Payable / daily expenses= days to pay cycle

Example:
$900,000 / 365 days= $2,465 daily expenses
$50,000 / $2,465= 20 days to pay cycle

In the above example it takes approximately 20 days for the company to pay its expenses. Some expenses are probably paid upon receipt and other expenses may offer up to 30 days or more to pay. If this metric could be stretched from 20 days to 30 days the company would retain approximately $24,000 in its bank account. This could give it more time to collect accounts receivable from its customers and allow it the cushion it needs to pay bills on time and feel comfortable meeting its obligations.

How could it stretch the days without upsetting its vendors? A couple of strategies:

  • Ask vendors for longer payment terms
  • Use a company credit card to “time” the payment to a vendor. Most credit card providers give you up to 30 days after your statement ending date to pay the outstanding balance. Depending on the timing of your payment, this can add up to 30 to 45 days more time to pay.

Know your accounts payable payment cycle. Monitor it on a regular basis and look at strategies to extend it while working with your vendors to pay within the agreed-upon time. The right accounts payable payment cycle could be the difference between positive or negative cash flow!

Filed Under: Blog, Cash Flow Forecasting, Cash Flow Planning, Numbers Coach TIPS Tagged With: business cash flow, cash conservation, cash flow forecast, cash planning, preserving business cash

Want More Cash Flow? Check your Accounts Receivable Cycle

April 13, 2023 by Mike Iverson

I sometimes hear from business owners that they are making a profit, but they don’t seem to have positive cash flow at the end of the year. What happened?

Your business may generate a positive net income, but if you aren’t monitoring other key cash flow drivers, then you can find yourself strapped for cash to meet the obligations of the business.

One of those drivers that can cause a lack of cash is your Accounts Receivable (A/R) collection cycle. It’s one of the four pillars that drive cash flow (along with Accounts Payable, EBITDA, and Inventory Days-on-Hand)

Your Accounts Receivable Cycle

Many businesses offer customers the ability to “Buy Now, Pay Later” for their purchases. In other words, they are providing customers a short-term interest free loan to pay for the product or service! If your customer doesn’t pay on time or takes longer than you expect, it can create a cash flow problem in your business.

Monitoring how long it takes for you to collect your accounts receivable is important. The quicker you can collect it, the quicker you get the cash you need to pay your bills and reinvest for your company’s growth.

But how do you measure it? Below is a formula to determine your collection cycle. Keep in mind your cycle will shift weekly, monthly, quarterly, etc… The calculation is merely a “snapshot in time,” but it’s important to know.

Formula:
Annual sales / 365 days= daily sales
Accounts receivable balance / daily sales= days to collect accounts receivable

Example:
$1,000,000 / 365 days= $2,740 daily sales
Accounts receivable $80,000 / $2,740= 29 days

In the above example, it takes on average about 30 days to collect the amounts owed by the company’s customers. If this metric increases from 29 days to 39 days, then the extra 10 days has left the company with $27,400 less cash in their bank account than if they had collected it in 30 days. This is where the business owner could see a positive net profit in the profit and loss statement, but also see that their cash balance has decreased by $27,400.

Know your accounts receivable collection cycle. Calculate it on a regular basis, such as monthly. Identify customers who are consistently not paying on time and determine a strategy to encourage them to pay within the terms you have offered. It can be the difference between positive or negative cash flow!

For more resources to help you measure this important metric, check out our Numbers Coach tools and templates.

Filed Under: Cash Flow Planning, Financial Metrics, Key Performance Indicators, Numbers Coach TIPS Tagged With: accounts receivable management, business cash flow, cash conservation, cash flow forecast, cash forecasting, cash planning, collection pattern, collection tips, key performance indicators, preserving cash, uncertain cash flow, working capital management

Building Your Financial Plan

February 27, 2023 by Mike Iverson

Any competent financial executive will say “a business needs a sound financial plan” to tie the numbers to a business owner’s strategy. But what does that really mean? It’s time to demystify this statement.

  • Define your objective.  Why do you run your business?  Your reason could be any of the following or something else, but it’s important to start with the end in mind:
    •    “I want a good, stable life style maintaining business.”
    •     “I want to increase my net worth so I can retire early and enjoy the good life.”
    •     “I’ll start a ground breaking business, grow it quickly and sell it so I can move on to the next adventure. I don’t want to get bored!”
    •     “I want to create a legacy for my family.”
  • Create a business plan.
    • Now that you have your objective in mind, the plan is simply the day-to-day activities that will help you achieve it.  This can be as simple as determining how many new clients you will need at X dollars per month, or more detailed with specific key performance indicators for all areas of the business (finance, operations, sales and marketing, HR, etc.)
    • It is easy to think of the plan as the tool. And it is – a well developed plan helps you manage to your expectations. It provides business measures to keep things on track. (And as we all know, if you don’t measure it you can’t manage it.)  But often overlooked is the value gained in going through the planning process – whether it’s a simple two-page plan or a full-blown book with multiple chapters. The business idea will be refined and honed, and valuable insights achieved during planning.
  • Execute.
    • Now it’s time to put the plan into action.  Without this step, a plan is just a piece of paper.  Start acting on your plan, find someone to keep you accountable to sticking with it, and celebrate your progress along the way.

Let me know how I can help you build your blueprint.  

Here’s to planning a successful year!   

Mike

Filed Under: Cash Flow Forecasting, Cash Flow Planning, Financial Modeling, Numbers Coach TIPS, Rolling Cash Flow Forecast, Rolling Financial Forecast Tagged With: business financial planning, business growth, business strategic planning, cash planning, company planning, strategic planning, tax planning

Want More Cash Flow? Check your EBITDA

February 9, 2023 by Mike Iverson

The life blood of any business is its ability to generate solid cash flow. Without positive cash flow, a company will eventually go out of business. This TIP will focus on one of four key pillars that drive cash flow. In this case we will look at “Earnings Before Interest, Taxes, Depreciation, and Amortization,” or more commonly known by the moniker EBITDA.

Where do you find this metric? One of the financial statements that you can get from your accounting system is the profit and loss statement. The very last number of this statement is typically labeled “net income.” Net income is the profit you have left over after paying all your expenses. When we add back to net income the interest expense, depreciation expense, amortization expense, and income tax expense we get the number for EBITDA.

EBITDA formula:

Net income +

  • Interest expense
  • Depreciation expense
  • Amortization expense
  • Income tax expense

= EBITDA

EBITDA is important for two reasons:

  1. It is a general indicator of your company’s ability to generate cash flow from the operations of your business
  2. It is used as part of the formula for valuing a business. Often someone who wants to buy a business will value it based on a “multiple” of EBITDA. In other words, they are buying your company’s ability to produce cash flow now and into the future.

To generate positive cash flow, you need to have a positive EBITDA. Otherwise, you are generally finding yourself starting your cash flow conversation in the negative position and will likely need to borrow money or find investors to provide capital to keep the company going.

Start with a positive EBITDA number and you can be more confident with your company’s ability to generate positive cash flow. Do you know your EBITDA?

Let us know if we can help you with this important metric.

Filed Under: Business Growth, Business Planning, Cash Flow Planning, Financial Metrics, Financial Modeling, Numbers Coach TIPS, Rolling Financial Forecast Tagged With: cash flow, cash flow forecast, cash forecasting, cash planning, ebitda, net income, uncertain cash flow

What Your Inventory Turnover Ratio Is Telling You

May 6, 2022 by greenmellen

Bankers who lend to small businesses in manufacturing and distribution often calculate a client’s inventory turnover ratio. “What are the bankers looking for in a ratio?” clients sometimes ask.

First, bankers wonder whether the business is carrying inventory that is disproportionate to its sales. Carrying excess inventory is not a productive use of capital when money is tied up in product that sits on a shelf and incurs warehouse costs.

A second concern for lenders is that inventory not turned over quickly will become obsolete, damaged, or outdated. In any of those circumstances, revaluation of the inventory is necessary and losses must be booked. That’s a concern to lenders.   Also a decreasing turnover rate could indicate a slowing sales and lower profit trend.

Calculating the Ratio

The ratio is only difficult to calculate if a business’s inventory varies significantly throughout the year. Inventory Turnover is calculated as Cost of Goods Sold divided by Average Inventory. The Cost of Goods Sold is always calculated for the Income Statement, so the figure is readily available. Average Inventory may be trickier. For businesses with fairly constant inventory levels, simply add Beginning Inventory to Ending Inventory and divide by two to calculate a simple average.

This simple average doesn’t always work well, however, because many businesses have significantly less inventory at the beginning and end of the year than at other times. The simple average, therefore, uses an artificially low denominator, which tends to overstate the Inventory Turnover Ratio.  So, if monthly inventory figures are available to calculate the average their use will provide a truer Inventory Turnover Ratio:

Using information from the table above, we can calculate Lerner’s Inventory Turnover Ratio for 2012 and 2013. The ratio is determined by dividing Cost of Goods Sold by Average Inventory for each year. For 2012, the calculation is 19,726,396/3,936,307=5.01. For both 2012 and 2013, Lerner turned over its inventory slightly more than five times per year. Bankers interested in Lerner’s Inventory Turnover Ratio would likely compare the Lerner ratio against those of other companies in the same industry. A turnover ratio significantly below those of Lerner’s peer group might cause bankers concern about inventory obsolescence.

Let us know if you would like to see how your ratio stacks up against those of your peers, or to discuss how to improve your ratio.

Filed Under: Business Growth, Business Planning, Cash Flow Planning, Financial Modeling, Key Performance Indicators, Numbers Coach TIPS, Rolling Financial Forecast, Working Capital Tagged With: cash flow forecast, cash forecasting, cash planning, financial metrics, inventory management, inventory turnover, key performance indicators, KPI, preserving cash, working capital management

Every Business Needs a Plan. . . But it Doesn’t Need to Be Long

January 21, 2021 by greenmellen

When a business owner wants to attract a business partner or hopes to raise investment capital, he or she needs a way to show where the company is headed. A business plan is the right tool for the job.

Many entrepreneurs don’t have business plans because they are unsure about how to begin, and the process seems terribly time-intensive. But, a business plan doesn’t have to be elaborate. In fact, the trend is toward something simple.

Have you heard of a one-page business plan? It is certainly a far cry from a traditional business plan that often runs 15 to 50 pages. A one-page plan is specifically requested by some investors, because they find it difficult to read all of the investment proposals that come to them.

The One-Page Business Plan

Proponents of a one-page plan believe there’s a great deal to be said for brevity. Most investors have neither the time nor the inclination to read more than the absolute essentials.

For instance, a one-page business plan is likely to describe:

  • The customer needs that your business addresses
  • Your products or services
  • Your principal customers
  • Your chief competitors
  • Your competitive edge
  • How you make money
  • Your management team
  • A financial summary
  • Your funding request

If you provide all the information on the list above, it’s likely enough for the typical investor. So, let’s focus on how to get all of the facts onto a single page.

For starters, don’t worry about writing complete sentences, and don’t spend time trying to make your plan look stylish. Commit to simplicity. Waste neither words nor space. For example:

Customer Need that the Business Addresses: LED lighting solutions for a variety of manufacturing applications

Products Sold: LED assemblies customized to a manufacturer’s specifications

Principal Customers: Warning Lights of North Georgia — 13% of annual sales; no other customer is > 5% of sales

Once you have compiled all of the information, consider hiring a professional to improve the presentation. A talented graphic designer can turn your information into a much more attractive page in a couple of hours by using business-appropriate spacing, fonts and icons that provide some visual interest.

As an alternative, software packages are available that provide templates for one-page business plans. Just answer the questions at the interactive prompts. It’s an easy, albeit more expensive, way to get started.

With a 20-year record of success, The One Page Business Plan Company is a testament to the power of the single-page approach. Its software solutions are cloud-based. If your business is ready for something more than the bare essentials approach, its one-page templates can help you develop:

  • A vision for your business success
  • A mission statement
  • Objectives
  • Strategies
  • Action plans

If you would like to get an example of a one page business plan that Trillium has used for clients feel free to send us an email request and we will send it out to you in a Word template form.

Filed Under: Business Growth, Business Planning, Leadership, Numbers Coach TIPS, Personal Development, Tax Planning Tagged With: business financial planning, business planning, business strategic planning, business strategy, cash planning, company planning, company strategy, strategic planning

Your Best Tool for Understanding Short-Term Cash Flow

September 17, 2020 by greenmellen

In a recent article, I shared ideas on how to positively position your company’s financials, even during a slowing economy.  The key is to ensure you have strong cash stores and credit availability.

Today, I will explain a management tool that helps you anticipate your near-future cash flow and identify any areas of weakness: Presenting the 13-Week Cash Flow Analysis. 

You may already use software that allows you to run regular cash flow analyses. These give a more accurate picture than net profit or bank statements.

Initiate your 13-week cash flow analysis by gathering the data needed to build an accurate report:

  • Current bank account and credit card balances
  • Upcoming mortgage or lease payments
  • Estimated cash receipts
  • Estimated payroll and taxes
  • Estimated operating expenses
  • Any other upcoming transactions that will impact cash flow.

The integrity of the report is dependent on the accuracy of the data as well as it being correctly entered or integrated into a spreadsheet or software. For the variable revenue and expenses you estimate, be sure to keep seasonal influences in mind. And remember, you only need to record and predict 13 weeks out – it’s a short-term tool.

A report with solid data and estimates is a good indication of your cash situation over the next 3 months (or, one full quarter). But check the output against your gut:  If the balance seems overly positive in any or all of the 13 weeks, review your estimates, especially sales and accounts receivable forecasts. Being overly optimistic won’t serve you well – if anything, conservative estimates will give you the padding needed to accommodate unpredictable changes.  If you have the time, run worst-, best- and average-case scenarios.

If the report indicates that your company will be cash poor at points during the next 13 weeks, it’s time to review your options:

  • Do you have unneeded equipment or inventory that can be sold to improve fluidity?
  • Are there expenses that can be eliminated, contracts that can be renegotiated or even dissolved, or payments negotiated or delayed?
  • Is it time to implement a collections push?
  • Is your billing and collections process quick and accurate?
  • Are there any loans available to the business?

Once it is set up, maintaining cash flow history and projections is easy. Monitor and update the report weekly, and review your historical projections against actuals to improve your modeling accuracy.

Cash and cash flow are critical to successful operations, and utilizing 13-week cash flow analyses will help you identify gaps and become better at anticipating your future cash needs to keep your business steady. So make proactive cash flow analysis one part of your flexible, resilient business, whether the economy and your customer demand are swinging up, down, or somewhere in between.

Filed Under: Blog, Business Growth, Business Planning, Cash Flow Forecasting, Cash Flow Planning, Financial Modeling, Rolling Cash Flow Forecast, Rolling Financial Forecast, Working Capital Tagged With: business cash flow, cash flow, cash flow forecast, cash forecasting, cash planning, preserving business cash, preserving cash, uncertain cash flow

Why a Slow Economy Doesn’t Have to Mean Dire Straits for Your Business

May 13, 2020 by greenmellen

Is the slowing economy adversely affecting Atlanta’s businesses, or is it a great time to be in business?

Well that depends mostly on your recent revenues. But even if those are in reverse, a slowing economy can be a great time to take advantage of some opportunities and position your business to come out of the gate at full speed when the economy takes an upswing.

We wanted to hear what local professionals in finance and business had to say about the current state of affairs. CFO service provider Mike Iverson and Vistage Chair Tim Fulton had some good tips for bad times.

Cash is King

The first step to understanding how to make sure your glass is half full is to assess your financial situation and understand exactly how much cash and credit you have. Even if cash flow is good, “Now would be a good time to go the bank,” says Mike Iverson, CPA and Principal of Trillium Financial, “before the economy gets worse or your company financials get worse. Go to the bank and make clear why you want a line of credit and what you will use it for.” It’s important to be proactive when it comes to having the cash stores ready. If you wait until you need it, your statements probably won’t look as good, and the bank may decline a loan or line of credit. Planning ahead is always a good thing. “The key to survival in an economic downturn is to out perform the market, and accumulate cash”, says Tim Fulton, a Vistage International Group Chair which works with over 14,000 chief executives in 16 countries.

Another aspect of understanding your capital position is modeling. How long can your business last with a certain amount of decline? What will you do to make sure you can weather the storm and start growing again? Imagine the various scenarios – even the truly ugly ones – and devise solutions before they come to fruition. You’ll be able to think more clearly in the face of adversity if you have a battle plan and, again, a line of credit to back you up. This doesn’t mean that you have to focus on the worst case scenario, just plan for it, then focus on your everyday business.

Modeling the tough situations is especially important if you are in a cyclical business; for example, the automotive industry. When the economy hits the skids, the average car dealership will probably see sales decline rapidly. Managers must have enough cash reserves to ride out the storm, and to pay for overhead and inventory so they can still be in business a year from now.

If you are a manufacturer, or a company that manages a lot of inventory, be mindful of your production capacity. You don’t want to continue to run at full capacity and end up with an overstock. Go to your clients and continually measure what they anticipate ordering from you in the next two to three months. For production purposes, you might have to scale back so the inventory on hand can be used, and not end up obsolete. On the positive side, manufacturers are usually the first to see orders are picking up. They’re not necessarily the canary in the mine shaft, but these businesses tend to provide a leading indicator.

The Positives of Slower Times

Once your cash situation is well-positioned, the glass is definitely half full. Now is the perfect time to expand your business through capital investments such as acquiring a struggling competitor. You can often take advantage of businesses being sold at fire-sale prices.

“When the economy bottoms out, there will be an abundance of great investment opportunities,” says Fulton. “The business owner with cash will be in a strong position to take advantage of these opportunities.”

Companies with cash can also get the upper hand over competitors by investing in the introduction of new products and in new technology that other business can’t afford. “If you can do any of these things”, says Iverson, “you’ll be in a different place than your competitors because you will be nine to twelve months ahead of them.  You will have something to offer customers that your competitors cannot.”

Companies who differentiate themselves in this way will be growing when everyone else is declining. Constantly look at opportunities to grow with products and services that will serve others struggling with hard economic times and continue to help them through good economic times,” says Iverson.

Another way to grow through a slowing economy is to ramp up marketing. While other companies cut their marketing budgets, Fulton recommends against this instinct. “Be very, very focused in your marketing strategies. This is not a time to be spending a lot of money on broad branding efforts. It is a time to be laser-focused on acquiring new clients and retaining profitable existing clients,” he says.

Iverson agrees. “Marketing is the last place you should cut back,” he says. “Marketing initiatives are priming the pump to create your sales engine. If you cut back on that, you cut back on future sales and opportunities. If everyone else cuts back on marketing, you will stand out even more, possibly turning that half-full cup to overflowing.”

Filed Under: Blog, Business Growth, Business Planning, Cash Flow Forecasting, Cash Flow Planning, Employer Tips, Financial Metrics, Financial Modeling, Own Your Numbers, Rolling Cash Flow Forecast, Rolling Financial Forecast Tagged With: business financial planning, business planning, business strategic planning, cash flow forecast, cash forecasting, cash planning, financial analysis, financial habits, financial management, financial metrics, strategic planning

  • 1
  • 2
  • Next Page »
NumbersCoach_Logo_green-gray_stacked

Proud Supporter of

Screenshot 2025-09-09 150120

Get Financial Tips Delivered To Your Inbox

Protect your business' financial health with our monthly financial tips.

Contact Info

P.O. BOX 250
Decatur, GA 30031

404-353-2148

info@numberscoach.net

© 2026 Trillium Financial, Inc
Privacy Policy | Accessibility | Terms